Agrovolo

Agrovolo is a one-stop-shop solution for aerial imaging data targeted at agriculture / land management use cases.
1. Background
Precision agriculture is the practice of utilizing data to make informed land management decisions. This approach to land management promises to make farming operations more efficient and environmentally friendly by identifying overuse of resources, such as fertilizers and irrigation. However, current solutions are often piecemeal. This project aims to prove that fully integrated land management data solutions are possible.
This is accomplished in a very narrow, concrete context: acquiring a visualization of the Normalized Difference Vegatative Index (NDVI) over a field from raw aerial data.
Aerial data is incredibly useful in land management decisions, as it offers a way for managers to get a grasp on their land in an intuitive manner. The NDVI is a value that ranges from -1 to +1 that contains information about the vegetative biomass at specific points of your plot. The index is defined as follows:
$$NDVI = \frac{NIR-Red}{NIR+Red}$$How does this seemingly arbitrary fraction lead to insights about vegetative biomass? See the below image for intuition:

For dead leaves, the NDVI is approximately 0, since NIR and Red light are reflected in nearly equivalent amounts. As the health of the plant increases, the amount of NIR reflected increases, until both the numerator and denominator are $\approx NIR$, leading to $NDVI \approx 1$.
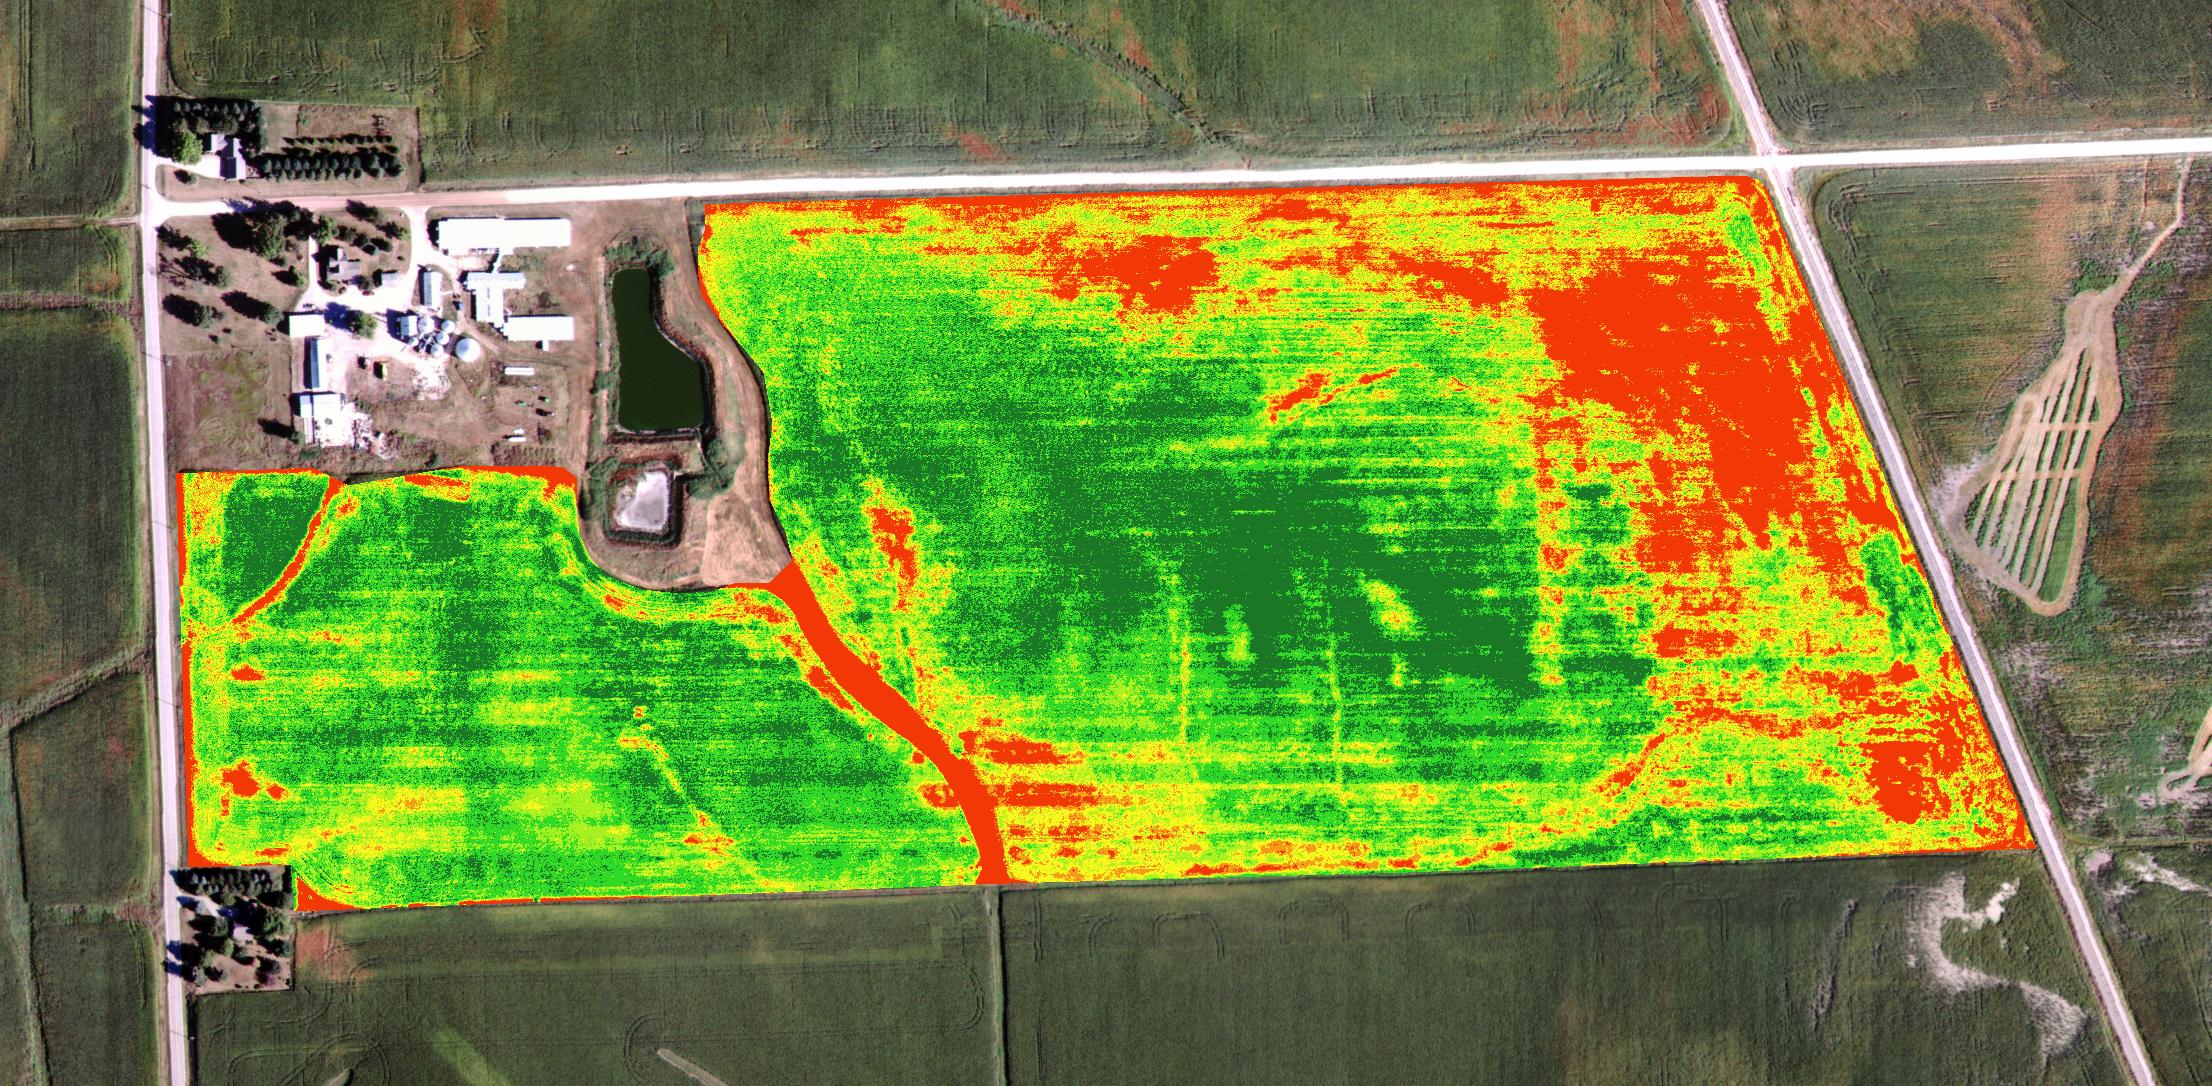
Therefore, if we take two images, one in the NIR band and the other in the Red, we should be able to apply this NDVI function to each pixel, and then map $[-1,1]$ to a color from red (poor health) to green (great health), and produce an easy-to-read map that gives insight into how plants on a plot are doing.
2. Mission
To develop an autonomous UAV that utilizes remote sensing techniques to create a high-quality map of the Normalized Difference Vegatative Index for any plot of land at any time.
To be more specific, the following goals shall be met in order for the system to be considered successful:
- Field Size - the system shall be capable of acquiring data of 100 acres within 30 minutes.
- Cost - the system shall cost less than $750 to manufacture.
- User interaction - the system shall be
3. System Overview
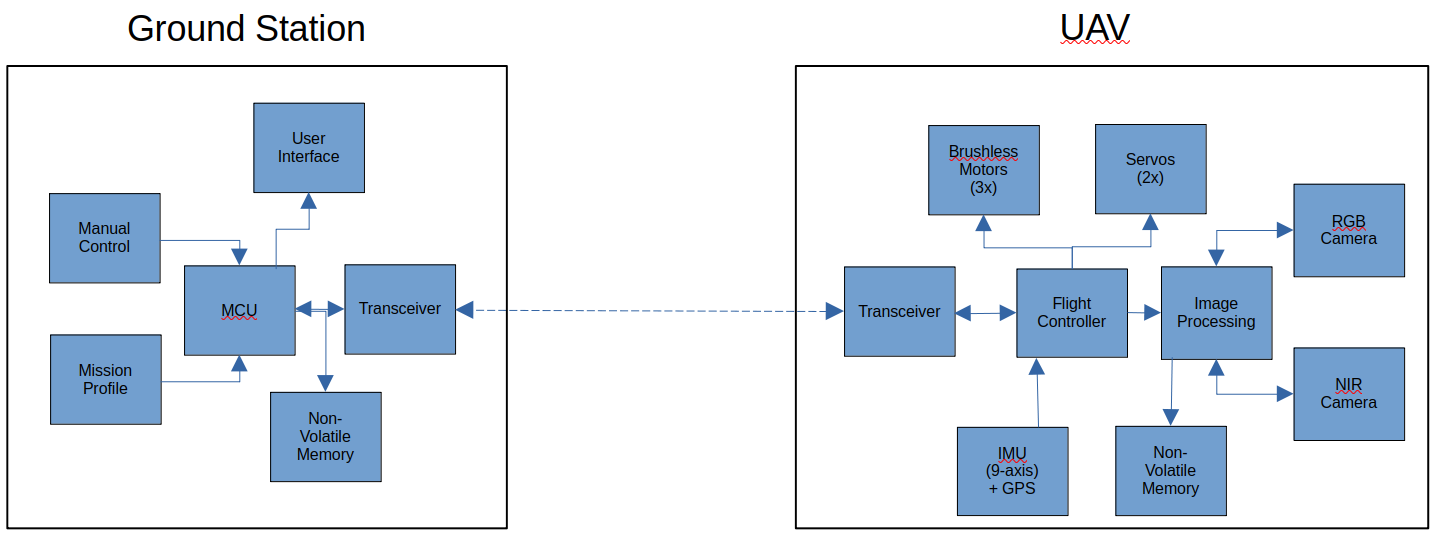
The block diagram for the system is shown below.
4. UAV
4.1 System-Level Requirements
The following system-level requirements are derived from the goals listed in the “Mission” section:
- Speed: The UAV shall be able to cruise at up to 20 meters per second.
- Power Consumption:
- Acceleration: The system shall be able to generate
4.2 Imaging System
The imaging system is comprised of:
- Image processing and storage: 1 Raspberry Pi 5
- NIR camera: 1 PiCam V2 NOIR + NIR optical bandpass filter
- Red camera: 1 PiCam V2
These components were chosen for the existing tooling available to take, process, and store images.
4.2.1 Image Processing and Storage
The existing PiCam tooling makes collecting, manipulating, and storing data from the cameras a breeze. Images are stored as 3-D arrays in the form [x,y,(r,g,b)], allowing the creation of a greyscale NDVI with incredible ease.
In order to generate a map that is easier to read, we map the NDVI to a color wheel, where $-1$ gives red, and $+1$ gives blue. This is called a color map.
There are many color maps to choose from. The following is an illustrative example:
<example start>
Consider the following representation of RGB color space:
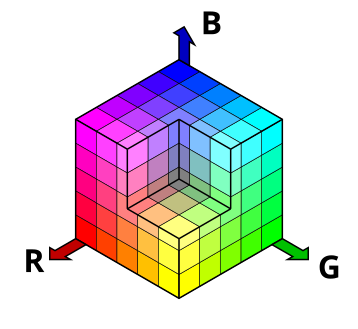
Consider for a moment that a simple arc from the red axis to the green axis, lying entirely in the red-green plane, would do the job nicely - the intensity of the image would be the same throughout, and would sweep from red to green. This arc can be described mathematically as:
$$c(\theta)=(I_{max}cos(\theta),I_{max}sin(\theta),0)$$We would like $c$ as a function of $NDVI$, with the following characteristics:
$$c(NDVI=-1)=(I_{max},0,0)$$$$c(NDVI=1)=(0,I_{max},0)$$
$$\theta = m\cdot NDVI+b$$
Solving, we obtain
$$c(NDVI)=(I_{max}cos(\frac{\pi}{4}(NDVI+1)),I_{max}sin(\frac{\pi}{4}(NDVI+1)),0)$$In general, $\theta$ doesn’t have to be a linear function of $NDVI$. We can choose any function we’d like - linear is just the simplest.
<example end>
The challenges arise from the following requirements:
- If the whole plot cannot be collected in one picture, the system shall take multiple pictures and stitch them into one NDVI plot.
- The data should be stored on a removable data volume, such as an SD card or a USB drive.
- The system shall be powered from a 4S, 1.5Ah LiPo battery.